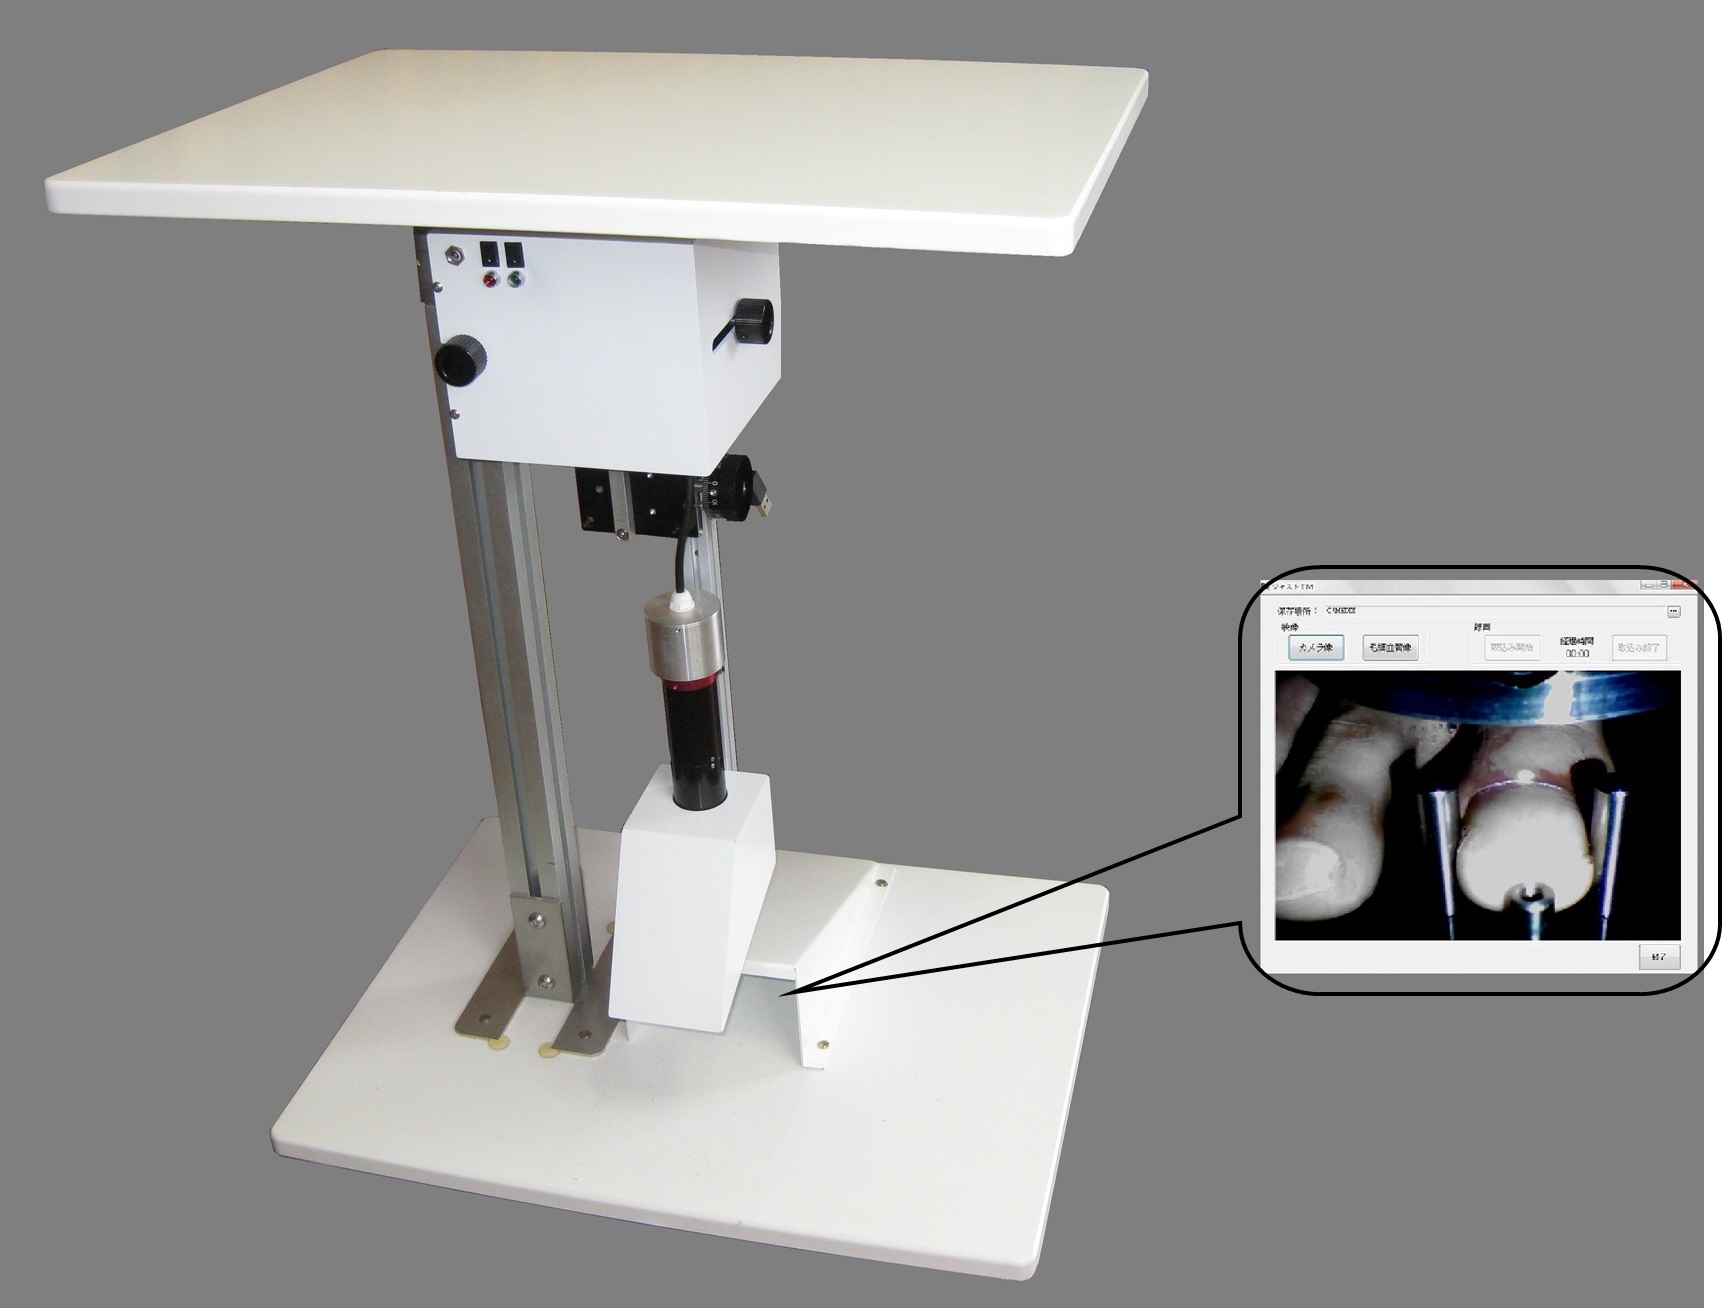
Blood Flow Video Capturing Software: Just-TM (exclusively for the TM420 models)

Camera image
・Specify the finger or toe to analyze.
Apply the solution oil to the target finger or toe, and adjust the focus to view the image.
・This is available only for the TM420.
Apply the solution oil to the target finger or toe, and adjust the focus to view the image.
・This is available only for the TM420.

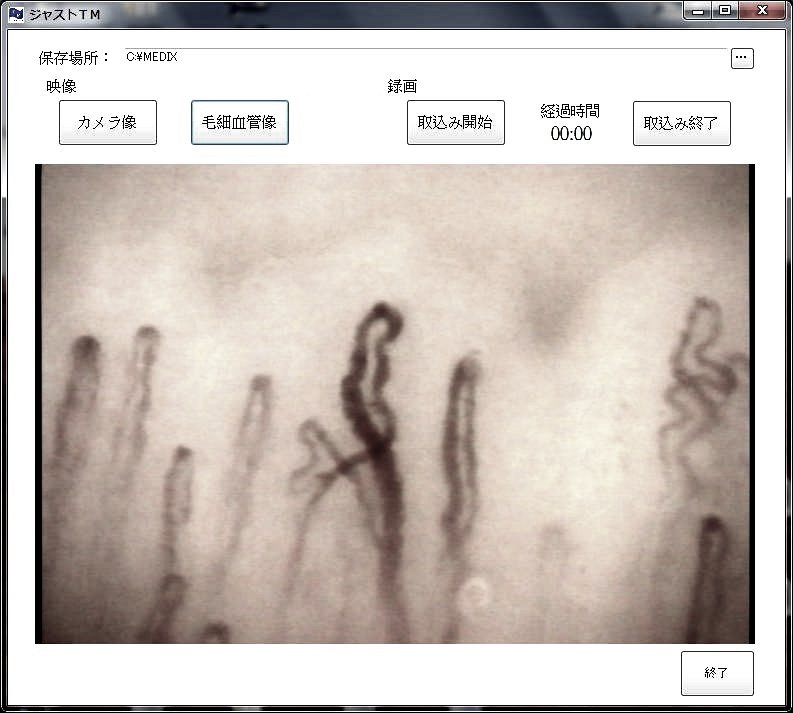
Capillary image
・Press the [Capillary Image] button, and focus.
・Press the [Start] button to start recording. Press [Stop] to complete the recording.
・Press the [Start] button to start recording. Press [Stop] to complete the recording.
Blood Flow Analysis Software: Medix (Blood flow speed, Blood flow rate, Blood vessel diameter)

Analysis Data captured in Real-time
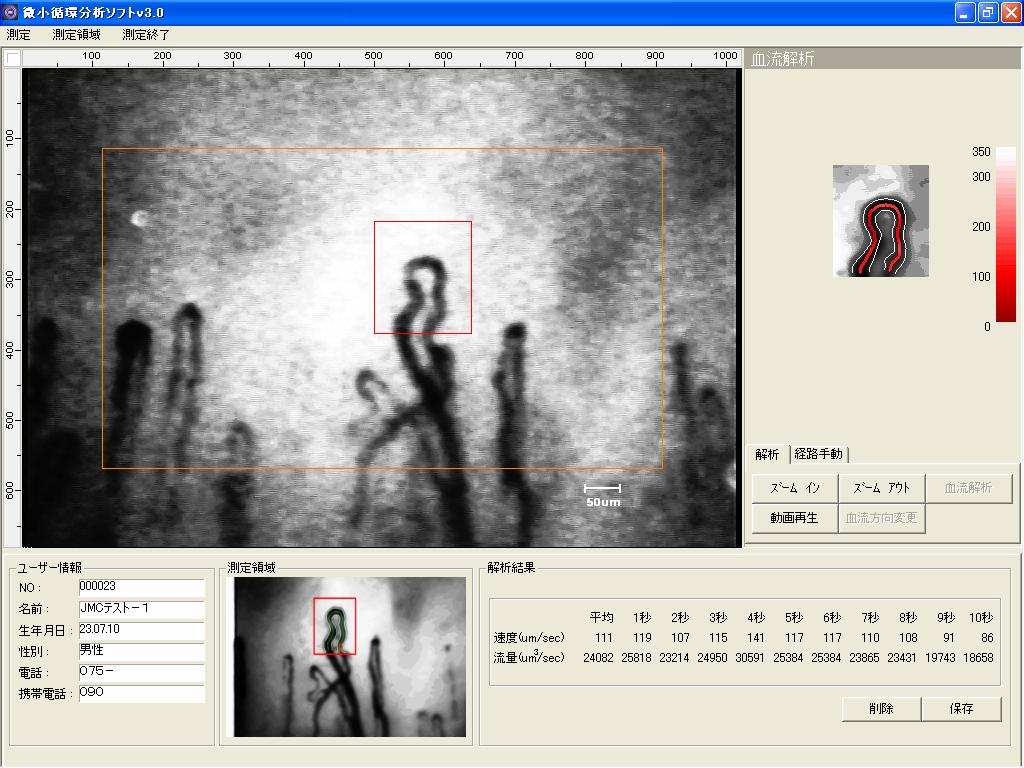
・The video captured by Just-TM is displayed after image stabilization.
・Set the analysis field to the target the capillary by using a mouse.
The blood vessel including the pathway being analyzed is displayed at the upper right of the screen. ・Pressing the [Blood Flow Analysis] button on the analysis tab shows the blood flow speed and the flow rate over 10 seconds at the lower right of the screen.
Supplementary function
・Selecting the blood vessel with the analysis path by using the mouse shows the diameter of the blood vessel at that point. Use [Zoom In] for improving visibility.
・Other available buttons are: [Zoom In], [Zoom Out], [Video Replay], and [Blood Flow Direction Change]

Time-series Analysis Data
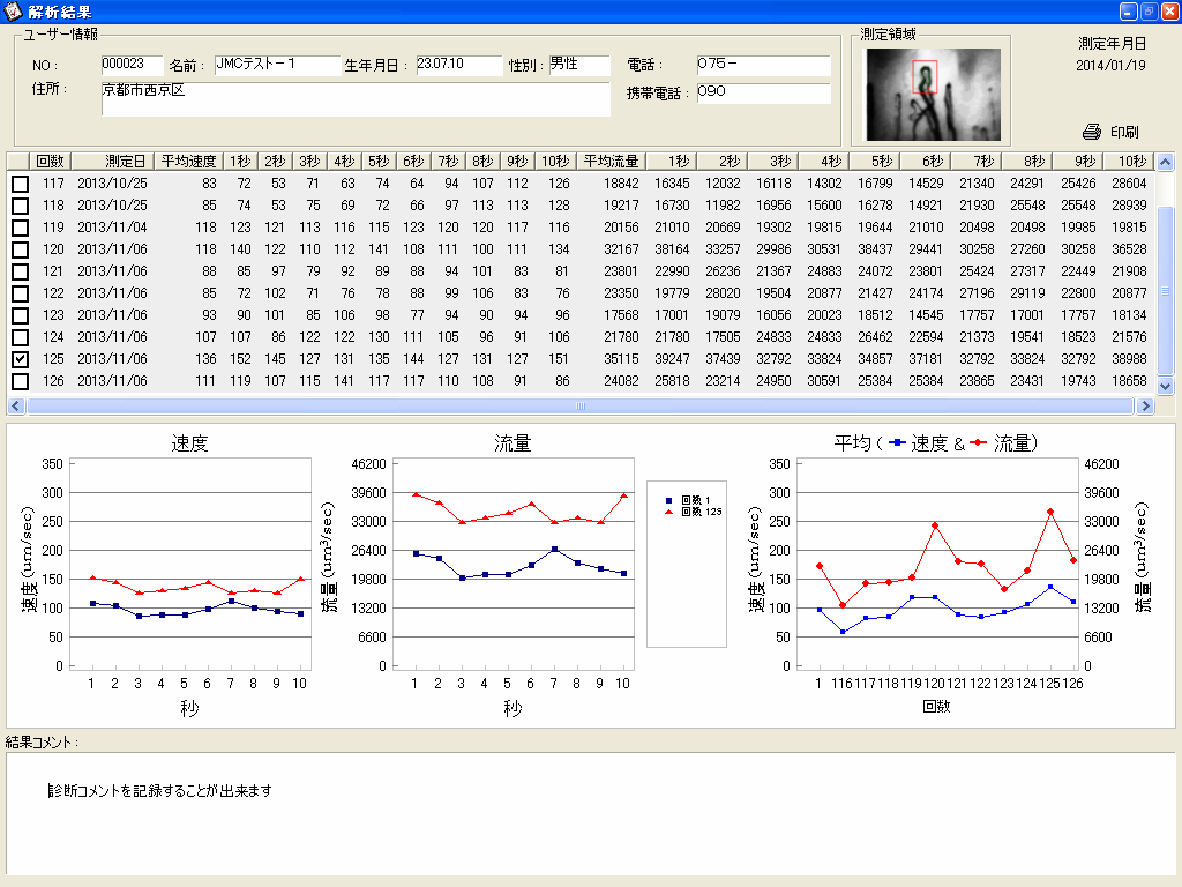
・The figures on the upper part of the screen indicate the time-series variation of blood flow speed, blood flow rate over 10 seconds per day of analysis.
There is a check box for each day of analysis. Placing a checkmark enables daily comparisons to be recorded on a line graph. ・Three line graphs in the center of the screen show the numerical values that were selected on the upper part of the screen.
The left side shows the variation in blood flow speed over 10 seconds.
The center shows the variation in blood flow rate over 10 seconds.
The right side shows the average blood flow speed and the flow rate for each day of analysis.
・The lower area of the screen provides space for comments, in which a comment such as the status or data trend information of the examinee can be recorded.
☆Placing plural checkmarks on the upper part of the screen allows comparisons of data variations between the data sets.☆
 株式会社 JMC